
Data FAQs
API and AvensorOPC
- Click the profile icon in the upper-right corner.
- Select External client resources.
- Click API documentation or Installation Guide to download the required file.
The documentation can also be found through the following steps.
This information is only applicable to customers that have the API access service enabled.
- Go to Admin > Customers.
- Select a customer.
- Go to the External clients tab.
- Click External client resources.
- Click API documentation or Installation Guide to download the required file.
Only a XRA can enable this service.
API access service must be enabled to communicate and get data from Avensor via Avensor APIs or AvensorOPC.
API access service must be enabled for the customer to use External client.
- Go to Admin > Customers.
- Click on customer name.
- In Customer details, click Edit.
- Check the API access checkbox and click Save.
Once the API access is enabled, the customer can add an external client to communicate through Avensor API or AvensorOPC.
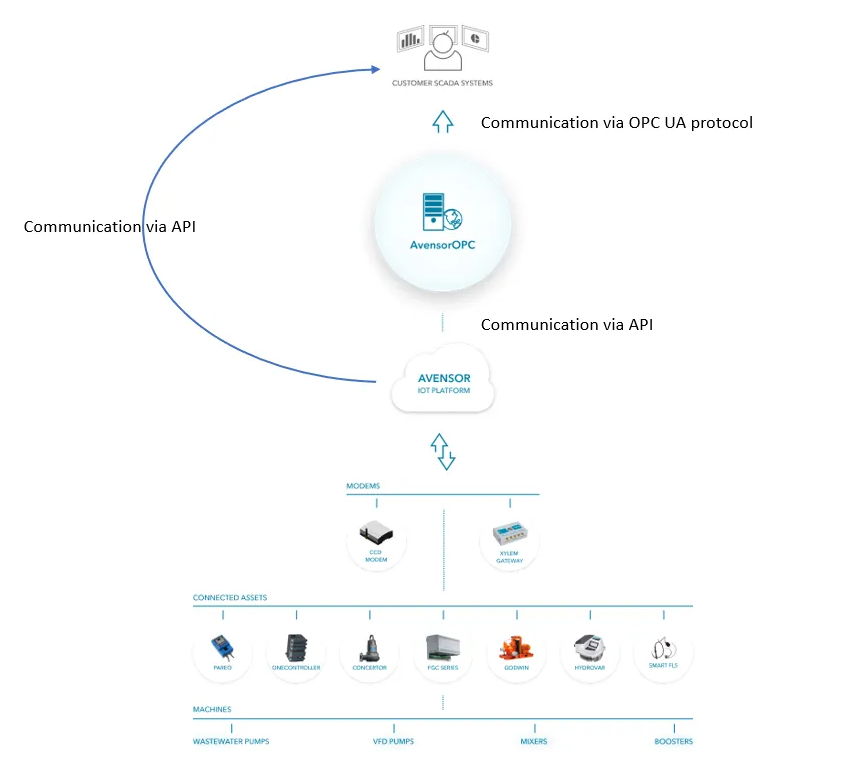
The application programming interface (API) and AvensorOPC are different ways for external systems to access data in Avensor. Customers that work with programmers use API as the access point. Customers that only work with integrators use AvensorOPC as the access point. The AvensorOPC functionality enables software with an OPC Unified Architecture client, for example a SCADA system, to read the station data.
- Click the profile icon in the upper-right corner.
- Select External client resources.
- Click the Installation package to download the AvensorOPC zip file.
The AvensorOPC zip file can also be downloaded through the following steps.
This information is only applicable to customers that have the API access service enabled.
- Go to Admin > Customers.
- Select a customer.
- Go to the External clients tab.
- Click External client resources.
- Click the Installation package to download the AvensorOPC zip file.
Analytics and live data
The current functionality does not allow the download of the live datasets into a single file. The user must download each dataset individually. It is possible to compare up to four datasets with the Compare feature in the Avensor application. The user can download the comparison graph data for the chosen datasets in CSV file format for further analysis.
For information on how to export the data, see 'How do I export the data in Avensor?' above. For information on how to compare the multiple data points, see 'How do I compare the time series for multiple data points?' below.
Avensor shows live data and connectivity status for the connected devices.
- The application stores the data.
- Trend graphs are shown for analysis of the data over time.
- The user selects which charts to show.
- It is possible to export the data for further analysis outside the application.
| Exported data | Available file formats | Data scope |
| Chart | • PNG • JPG • SVG • CSV |
Data for the selected time period and resolution. |
| Raw data | • Excel • CSV |
All the data for the selected time period |
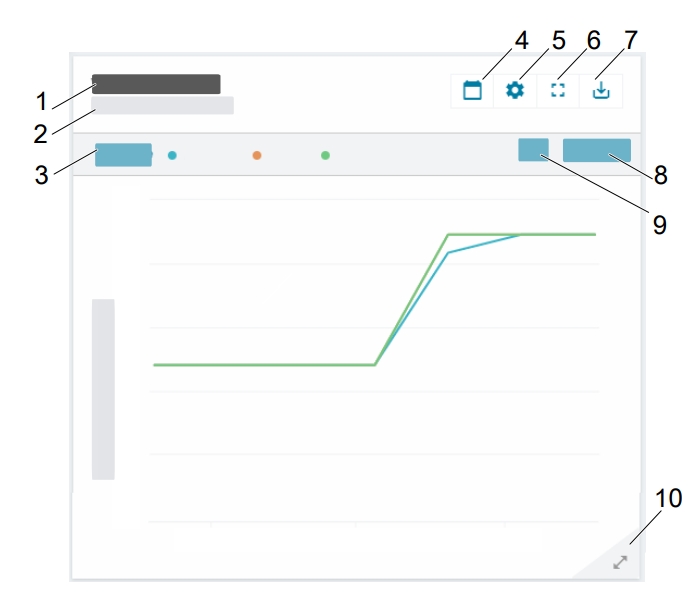
- Data point
- Data source
- Compare charts
- Select period
- Chart settings
- Full-screen mode
- Export chart
- Select resolution
- Select period
- Change chart size
The station analytics has three graph types that are described in the table below.
| Graph type | Description |
| Data points plot | The graph type is applicable to data points that are given by a sensor, such as water level and power output. The graph plots the maximum, minimum, or average values for the selected time period and resolution. Dependent on the sensor sample rate, the appearance of the graph can change between different selections of time period and resolution. |
| Counter delta | The graph type is applicable to counters that are given by a device, such as number of pump cleanings and energy consumption. The graph shows the increase of the counter value for the selected time period and resolution. If the counter value decreases, the counter is reset. |
| State count and utilization | The graph type is applicable to the pump running status that is given by a device: • The pump starts counter shows the number of event starts for the selected time period and resolution. • The utilization chart shows the pump utilization in percentage or in time for the selected time period and resolution. See also 'How do I change the unit (percentage/time) for the chart that shows pump utilization?' below. |
The graphs can be combined in the same chart for comparison. For more information, see 'How do I compare time series for multiple data points?' below.
- Go to Stations.
- Select a station.
- Go to Analytics.
- For any chart that has a time series, click the Compare button.
- Select a maximum of four data points to be compared.
- Click the Compare button.
The time series for the selected data points show in the same chart. - If required, configure the comparison chart:
- To style the chart, click any of the data-point titles.
- To open the chart in full screen, click the
 button.
To reset the chart:
- For the chart that has a comparison, click the Compare button.
- Click Reset.
- Go to Stations.
- Select a station.
- Go to Analytics.
- In the chart Utilization, click the name of the series that is to change its unit.
- Click any unit to select it.
Avensor updates the chart with the selected unit.
This information is applicable to stations that has an analog input that measures the power.
- Go to Stations.
- Select a station.
- Go to Analytics.
These charts show:
- The chart System power plots the power for the selected time period and resolution.
- The chart Energy consumption plots the energy consumption for each time unit. Dependent on the selected time period and resolution, the chart can show the hourly, daily, or weekly consumption.
- APP 411
- APP 412
- FPG 415
- FPG 411/412
- FPG 413/414
- FGC 401/411/421
- Hydrovar HVL
- MAS 711
- MAS 801
- SRC 311
- MyConnect
- PS 220
- SmartRun Gateway
In addition to the above mentioned devices, the following devices can also read the data when configured to read the energy consumption.
- Analog Input
- SENECA Z-8AI
This information is applicable to stations that has an analog input that measures the flow rate.
- Go to Stations.
- Select a station.
- Go to Analytics.
These charts show:
- The chart Flow plots the flow rate for the selected time period and resolution.
- The chart Volume-Flow plots the volume for each time unit. Dependent on the selected time period and resolution, the chart can show the hourly, daily, or weekly volume.